Observability is a product contract
Design observability around the decisions people need to make, connecting logs, metrics, traces, freshness, and user-visible failure states.
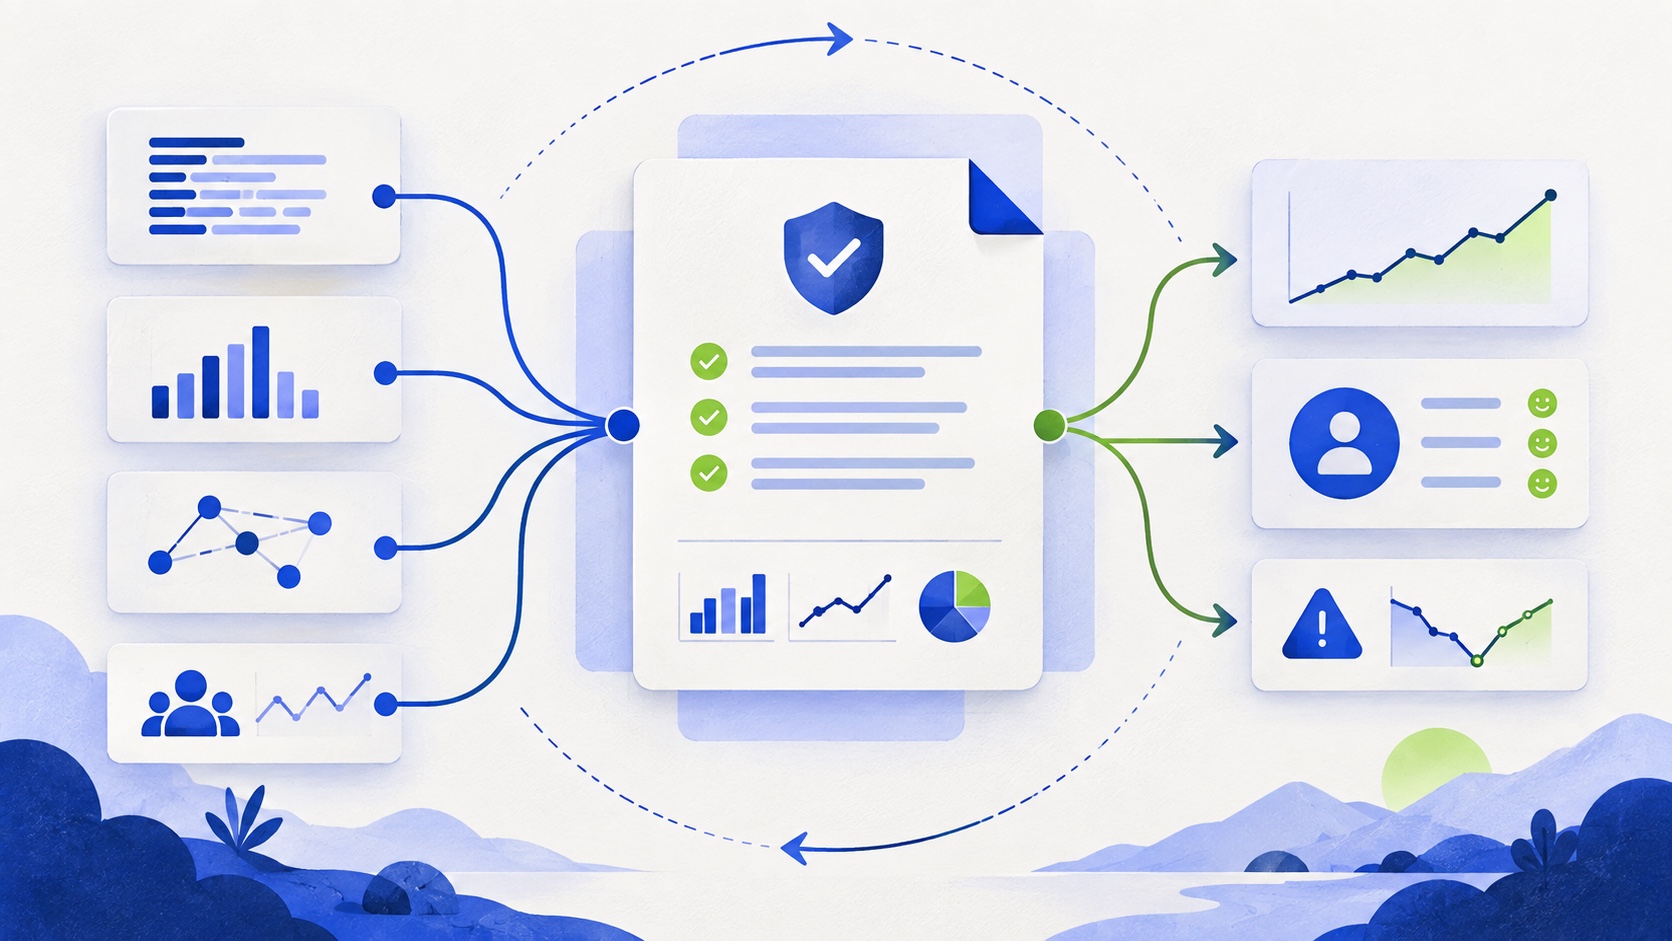
Observability is often treated as an operations concern: add logs, expose metrics, collect traces, and build a dashboard for the incident channel.
Those are useful tools. They are not the whole practice.
Observability is the contract that lets a person understand what a system is doing from the evidence the system makes available. That person may be an engineer during an incident, a product manager investigating a report, a support team explaining a failure, or a user deciding whether to trust a result.
If the system can calculate a number but cannot explain its scope, freshness, or failure state, it is not fully observable from the perspective of the person who needs to act.
Start with decisions
An observability signal is useful when it helps someone make a decision.
Before choosing a metric, ask:
- What decision will this support?
- Who needs the answer?
- How quickly do they need it?
- Which dimensions distinguish normal variation from a real problem?
- What action should follow when the signal changes?
For an API, the decision may be whether to roll back a release. For an analytics report, it may be whether the data is current enough to use. For a background job, it may be whether to retry, pause, or escalate a stuck item.
This prevents the common failure mode of collecting everything and understanding nothing. A dashboard with hundreds of charts can still leave the operator asking the basic question: is the system broken, delayed, empty, or behaving as designed?
The three signals are not interchangeable
Logs, metrics, and traces answer different questions.
- Metrics show how a value changes across time or groups.
- Logs preserve details about an individual event or decision.
- Traces show how one operation moved across boundaries.
A metric can tell you that report latency increased. A trace can show that the database query consumed most of the request. A log can explain that the query used a fallback path because a materialized view was stale.
None of these should be forced to carry the entire explanation. The system needs links between them: operation identifiers, route names, report types, and stable resource scopes.
type OperationContext = {
  traceId: string
  operation: string
  tenantScope: string
  reportType?: string
  freshnessState?: "current" | "delayed" | "stale" | "failed"
}
The context should identify the operation without recording sensitive payloads. It gives every signal a shared vocabulary.
Context is more valuable than volume
A log line that says request failed is technically a log and operationally weak. It does not say which operation failed, which dependency was involved, whether the request was retried, or what the caller can do next.
Useful context often includes:
- operation name;
- stable request or trace identifier;
- outcome category;
- dependency and duration;
- retry count;
- cache state;
- data freshness;
- and safe resource scope.
Context must be designed with privacy in mind. A tenant identifier may be useful for aggregation but should not expose personal data. A request body may contain the exact information an incident responder does not need. Observability should make the system legible without turning logs into an uncontrolled copy of the database.
Distinguish empty, delayed, and failed
Analytics products expose an important observability problem: a successful HTTP response can still represent an incomplete or unusable answer.
An empty result may mean there were no events. A delayed result may mean ingestion has not reached the requested time. A stale result may be the last known value from a cache. A failed result may mean the source or query was unavailable.
If the backend returns these states as one empty array, the frontend cannot communicate the difference. Users see a blank chart and invent an explanation.
I prefer an explicit state alongside the data:
{
  "state": "delayed",
  "data": [],
  "freshThrough": "2026-08-24T14:05:00Z",
  "message": "Events after 14:05 are still processing."
}
This is not unnecessary verbosity. It is the product contract that connects pipeline observability to the person reading the report.
Measure the complete operation
Timing one HTTP request is not enough for a system with multiple clocks.
For a dashboard, I want to separate:
- time to first useful structure;
- time until the primary metric is ready;
- time from filter change to acknowledgement;
- time until the selected scope is fully reflected;
- and time from source event to visible report freshness.
For a background workflow, the equivalent may be:
- time to enqueue;
- time waiting for a worker;
- processing duration;
- retry delay;
- and time until the final state is visible to the user.
These measurements reveal where the experience actually waits. A page can render quickly while the data pipeline remains delayed for minutes. A job can process quickly after sitting in a queue for an hour. Average duration hides the difference.
Cardinality is a design constraint
More dimensions can make telemetry easier to filter and much more expensive to store. Attaching raw user identifiers, URLs, query strings, or arbitrary event names to a metric can create high-cardinality problems.
I choose metric dimensions from the decisions they support. A report latency metric may need report type, operation, and result state. It probably does not need a unique customer email as a label.
High-cardinality detail belongs in logs or traces with retention and access controls, not automatically in every time-series label.
The right question is not “Can we record this field?” It is “Which analysis requires this field, and at which signal layer should it live?”
Traces should cross boundaries
A trace becomes valuable when it follows an operation across the places where its meaning can change.
For a report request, that might be:
- browser interaction;
- API route;
- authorization and scope construction;
- query builder;
- analytical database;
- cache or aggregate path;
- response mapping;
- rendered result.
Each span should answer one question. The API span can show the selected scope. The query span can show the query class and duration. The data pipeline can show freshness. The frontend can show when the result became readable.
Tracing every internal function creates noise. Tracing every boundary where latency, scope, or failure semantics can change creates understanding.
Alerts should describe action
An alert is not a notification that a number crossed a threshold. It is a request for a decision.
An actionable alert says:
- what changed;
- how large the change is;
- which users or operations are affected;
- how long it has persisted;
- and what the first diagnostic step should be.
“Error rate high” is a weak alert. “Report queries using the raw-event path have exceeded the latency budget for 10 minutes, affecting three report types” gives an operator somewhere to start.
Alert thresholds should also reflect the product contract. A data freshness alert may be more important than a small increase in request latency if the product promises current reporting. An internal batch can tolerate a short delay if users are not blocked.
Observability must survive failure
The most important signals are often the hardest to emit. A process can fail before flushing logs. A dependency timeout can prevent the trace from closing. A queue can stop processing the very event that would have reported its health.
Design for partial observability:
- record important state transitions durably;
- use heartbeats for long-running jobs;
- preserve the last known freshness marker;
- emit failure counters from a separate path when possible;
- and make missing telemetry itself detectable.
If a dashboard says “no data” because the telemetry pipeline is broken, that state should not look like a healthy zero.
Test the signals
Observability code needs tests too. Otherwise, a refactor can remove the field that makes an incident diagnosable while all business tests continue to pass.
Useful tests include:
- every request carries a trace or operation identifier;
- authorization failures do not log sensitive request data;
- retries increment the correct counter;
- stale results include freshness metadata;
- a failed dependency closes or marks the trace correctly;
- background jobs record progress and final state;
- and alert payloads contain the required action context.
These tests are small and valuable because they protect the explanation layer around the system.
Observability is a product feature
Users do not call it observability when they see a “data delayed” state. They call it an honest product. Operators do not call it a contract when a trace links a timeout to a query and a freshness gap. They call it a diagnosable incident.
The implementation still involves logs, metrics, traces, storage, and dashboards. The design starts earlier, with the decisions the system must support and the distinctions the user must be able to see.
An observable system does not expose every internal detail. It exposes the right evidence at the right boundary, with enough context to act and enough restraint to remain safe.